
Electronics & IT&C: 428.184 unique orders across 32 months
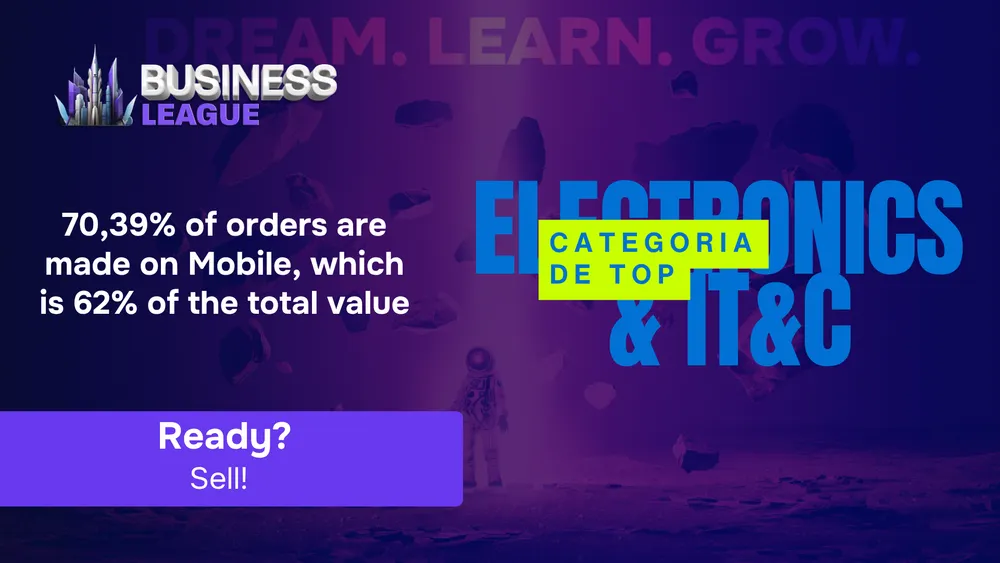
Yup. we got worked on our usual monthly analysis, and this time it covers the Electronics & IT&C category.
The period analyzed spans 32 months (July 1, 2024 – August 31, 2026) and covers: 428,184 unique orders placed across 148 active stores. Our report reveals the mechanics behind electronics and IT&C purchases. With a total value of €74.37 million generated (the equivalent of 32.59% of the entire value transacted in the BusinessLeague ecosystem) and over 23.3 million clicks brokered by affiliates, the category has by far the highest average basket in the ecosystem: €173.68, compared to just €41.03 across the entire ecosystem.
Here are the most important takeaways every retailer or marketer in the Electronics & IT&C space needs to know:
1. Mobile vs. desktop
70.39% of orders come from mobile, but this volume doesn't automatically translate into value: mobile generates only 62.37% of sales, while desktop, with just 29.61% of orders, brings in 37.63% of the value.
The difference is clear in the average basket: €143.74 on mobile, versus €206.18 on desktop.
At the operating system level, the pattern repeats even more sharply:
- Android dominates volume (48.42% of orders, 151,395 orders), but has the lowest average basket: €132.82.
- iOS (iPhone) brings in 21.97% of orders, with an average basket of €167.82.
- Windows accounts for 25.61% of orders, but the average basket climbs to €206.46.
- macOS, despite just 3.29% of volume (10,288 orders), has the highest average basket of all: €218.59.
The desktop effect: A Windows user leaves roughly 55% more in their basket than an Android user. Expensive electronics — laptops, PC components, gaming equipment — are bought predominantly on the big screen, where the decision involves more research and comparison.
2. The basket: nearly 94 out of 100 orders contain a single product
Unlike categories such as Books, where bundling products is the norm, in Electronics & IT&C single-item purchases are clearly dominant. Out of the 281,284 baskets analyzed:
- 1 product: 93.75% of orders (263,702), accounting for 90.42% of value
- 2 products: 3.71% of orders
- 3–5 products: 2.05% of orders
- 6 or more products: just 0.49% of orders
The overall average basket for the orders analyzed is €151.84, but value climbs steadily with the number of products: from €146.45 for a single product, up to €490.91 for baskets with 6+ products.
3. Price segments: the few big orders make the difference
The distribution across value ranges shows a highly polarized market. Orders under €100 account for 56.33% of volume, but contribute only 12.23% of total value.
- Under €25: 22.87% of orders, but only 1.98% of value
- €250–500: 14.81% of orders, but 29.53% of value — the largest share of value of any range
- Over €1,000: just 1.63% of orders (6,976 orders), but 14.87% of value (over €11 million)
Orders over €1,000 have an average basket of €1,585.18, nearly 9 times higher than the category's average basket. Though few in number, these orders carry significant weight in the total — a sign that premium laptops, complete security systems, and large appliances make the difference in revenue.
4. Time and day of purchase: the workday dominates
Purchasing behavior closely follows the daily schedule:
- Daytime (09:00–18:59) concentrates 63.99% of orders.
- Evening (19:00–23:59) brings in 25.64% of orders, with the highest average basket of any time slot: €174.39.
- Nighttime (00:00–05:59), while accounting for only 4.54% of orders, has the highest average basket of all: €179.86.
At the weekly level, Monday is the highest-volume day (17.35% of orders), with volume declining steadily toward the end of the workweek. The weekend (Saturday + Sunday) accounts for only 21.24% of orders, with a smaller average basket — €164.21, compared to €173.55 on weekdays.
A positive signal for the shopping experience: median time-to-buy (TTB) has decreased steadily, from 16.9 minutes in 2024, to 15.4 minutes in 2025, to just 13.9 minutes in the first eight months of 2026.
5. The affiliate channel footprint: volume vs. conversion
Google Shopping Ads (CSS) dominates the category: 68.26% of clicks, 70.42% of orders, and 66.01% of value, with a conversion rate of 1.90%.
But smaller channels, geared toward closing the transaction, convert far better:
- Cashback: conversion rate of 6.86% — over 3.6 times higher than Google Shopping Ads — and the highest average basket among channels with significant volume: €279.47.
- Coupons / vouchers: conversion rate of 5.89%, average basket of €245.82 — 51% higher than that of Google Shopping Ads.
- Buy now pay later: has the highest conversion rate in the category, 18.55%, but remains a niche channel, with only 306 orders (0.07% of volume).
The intent-channel effect: users arriving via cashback or coupons have already made their purchase decision — their click is the last step, not the first, which explains both the high conversion and the higher average basket.
6. Category champions: strong concentration among stores and affiliates
The top 10 stores account for 86.88% of the category's volume and 94.59% of its value. flanco.ro leads by a wide margin, with 78,225 orders (18.27% of the category) and €15.53 million in sales. Interestingly, evomag.ro, in second place, has fewer orders (67,940) but a higher value — €18.88 million — a sign of a superior average basket.
Concentration is even more pronounced on the affiliate side: the top 10 affiliates account for 84.37% of volume and 84.09% of value, and a single affiliate — Ovidiu.Golea-BigConvert.com — is responsible for 35.97% of all orders in the category (154,000 orders) and for nearly €28 million in sales, almost 38% of the category's total value.
You can download the full report here:

Articole Recomandate


BusinessLeague Pulse W42: 48,302 Sales, +14.9% Clicks YoY & 100% Network Fee for Freelancers in Round 3
The complete breakdown of Week 42 (October 12–18, 2026) in BusinessLeague: 48,302 sales (+5.4% YoY), over 1.28 million clicks (+14.9% YoY), Operation Robin Hood expanding to Freelancers, and all Round 3 rankings.

Tudor Stănică (Community Manager, BusinessLeague): “Surprises are what get me out of bed every morning”
He used to be an affiliate and sat at dinners hosted by advertisers. 5 years ago he joined BusinessLeague, and today he’s a Community Manager. Here’s the profile of a man who knows both how many sales his affiliates make and how many kids they have.

Georgiana Irimus (Apiland.ro): We're preparing Black Friday discounts, but the ApiLand anniversary remains our special moment of the year
On its 24th business anniversary, Apiland.ro answered a few of our questions courtesy of Georgiana Irimus. A conversation about progress, values and, of course, sales. ApiLand currently ranks first in the Start-Ups leaderboard, with more than 700 sales this round.

Pharma: Over 1.3 Million unique orders in 33 months across BusinessLeague
Pharma brings in one in five orders across the BusinessLeague ecosystem, but only 10.32% of the value: a category of small baskets, bought often and bought fast.